- Market Overview
- Futures
- Options
- Custom Charts
- Spread Charts
- Market Heat Maps
- Historical Data
- Stocks
- Real-Time Markets
- Site Register
- Mobile Website
- Trading Calendar
- Futures 101
- Commodity Symbols
- Real-Time Quotes
- CME Resource Center
- Farmer's Almanac
- USDA Reports
Wall Street Bought the Rumor in Micron Stock, So Should You Sell the News? A Pre-Earnings Look at This Dot-Com Bubble Survivor.
/Micron%20Technology%20Inc_%20logo%20on%20building-by%20vzphotos%20vis%20iStock.jpg)
Micron Technology (MU) reports earnings on Tuesday, Sept. 23, after market close. Traders know that most big tech companies have already reported results this season. So when there’s an outlier like MU, it is bound to get more focus. Because let’s face it, Wall Street really digs tech’s earnings “events!”
Some follow MU because it is one of those much-hyped “AI plays.” Its high-bandwidth memory, or HBM, chips speed up data movement. That’s something AI accelerator companies, the new icons of Wall Street, need to have any chance of living up to long-term growth estimates. So any news from MU is significant now. And earnings? Big-time attention-getter.
Yet for those of us with more grey hair (or just a lot less hair now), MU is also a reminder of a different time. The dot-com bubble, which really kicked into high gear around 1995, the time CNBC television really started to hit its stride. That’s no coincidence.
And as they celebrate the 30th anniversary of that network’s morning “Squawk Box” show, I can’t help but tie together the current market, and that of late last century. Because in many ways, today is like that era, which ultimately led to catastrophic declines in the Nasdaq Composite Index, and most of its member companies. However, the bubble went on much longer than many believed it could. So here we are, 30 years later, with the same type of decisions at hand. And MU, about to report earnings. Time flies.
What Wall Street Expects from MU Earnings
Barchart has a great, insight-filled page devoted to earnings. So let’s highlight a few data points on MU.
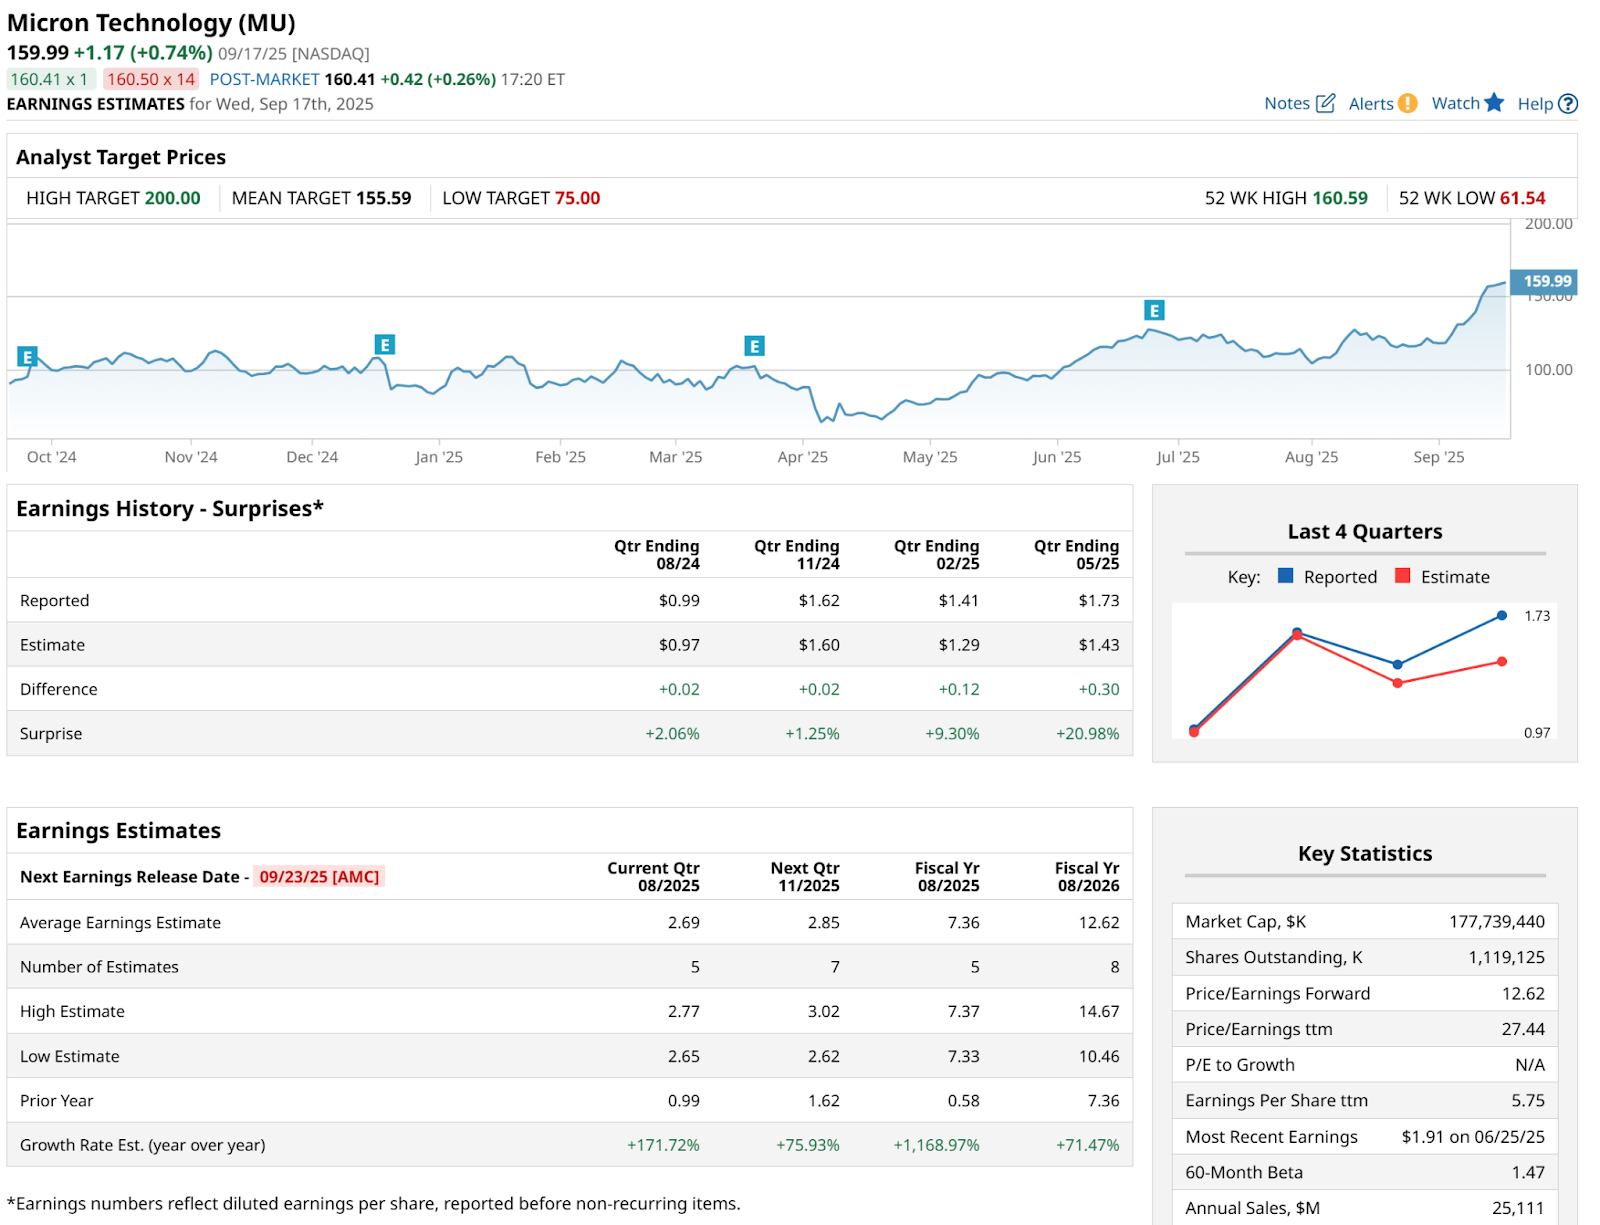
Here are a few items that stand out to me:
- After beating earnings so handily in the past couple of quarters, not doing so next week would likely create some big problems for Micron stock.
- MU is up nearly $100 a share since its April low. A move like that, all the way to $160 as of Wednesday’s close, indicates expectations are high. Caution is warranted here.
- This is a mature stock, and no stranger to analysts. That has produced a very narrow range between the high and low earnings estimates for the upcoming quarterly report. $2.77 to $2.65 from top to bottom.
MU’s Chart: Something for Everyone?
What would an MU bull say about this chart? That it appears to be one step away from breaking out to a new high. And earnings could be that step.
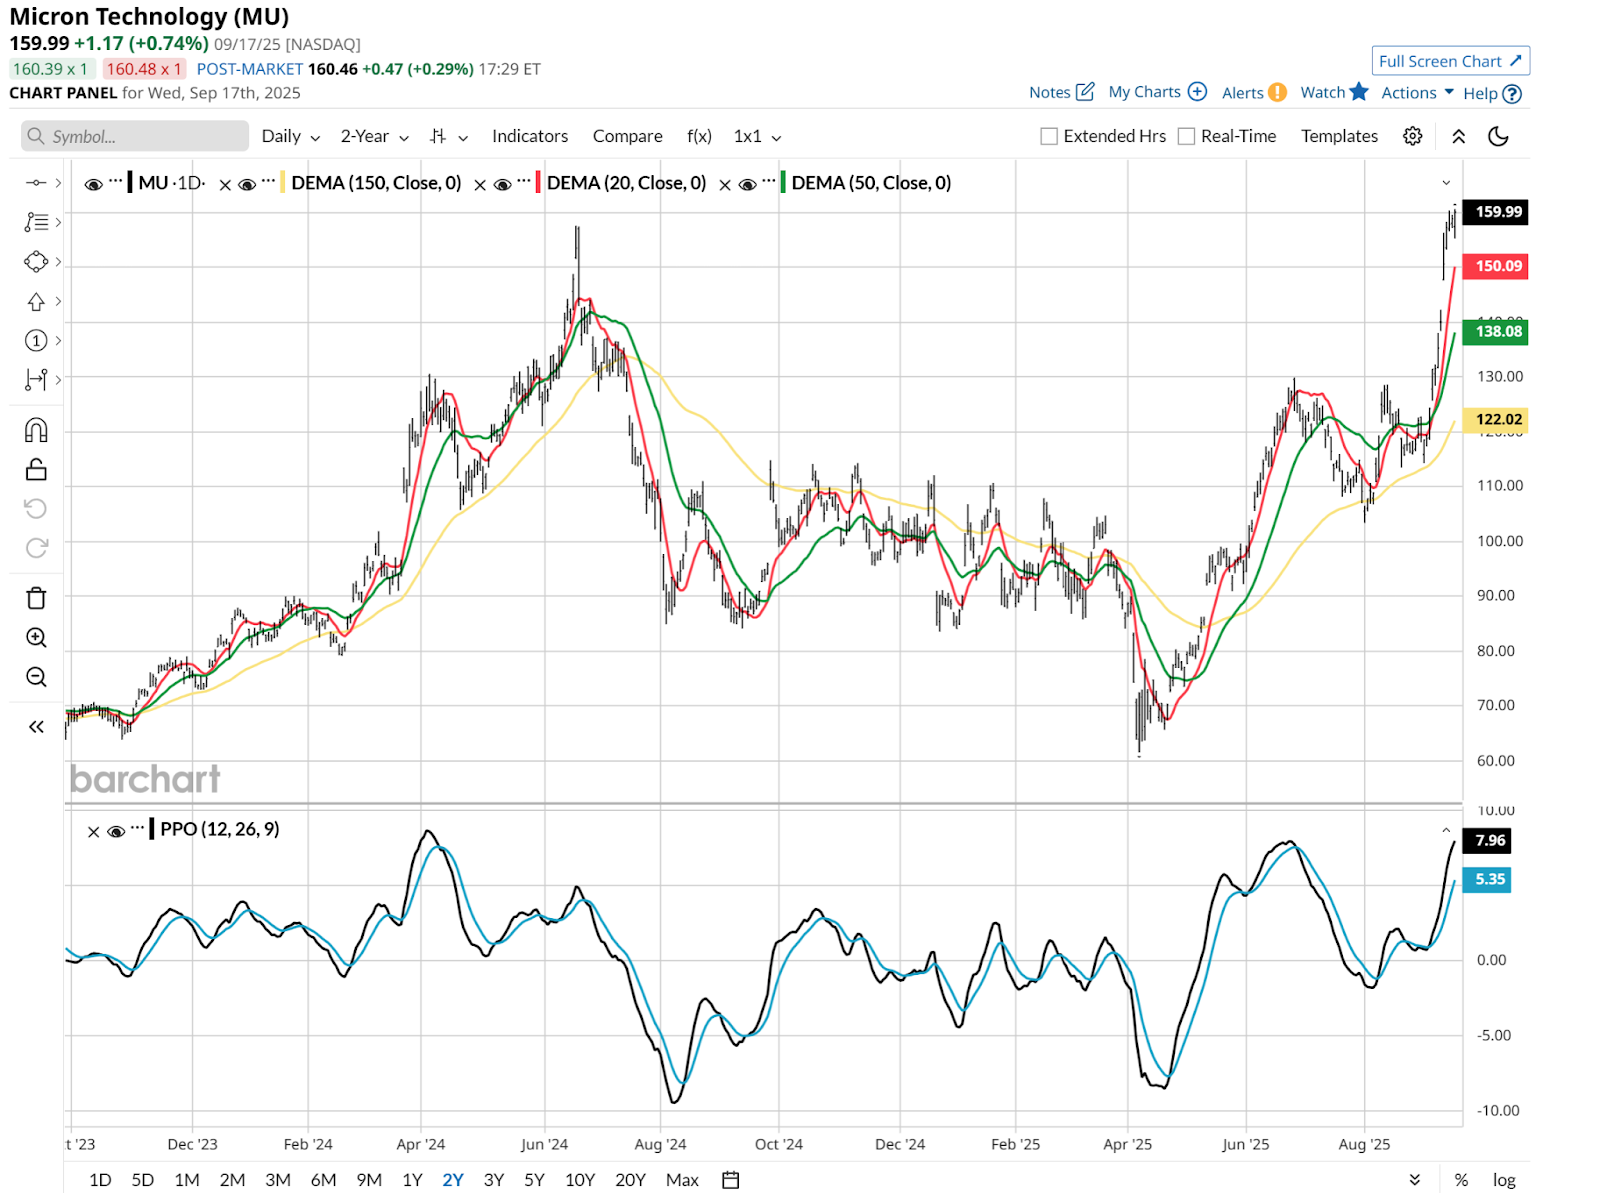
What would a bear say about this chart? It could be double-top, run away! Fortunately, the market will decide.
Oh No, Not the 30-Year Monthly Chart!
Yes, this dot-com survivor is going there. I learned to chart at age 16 in 1980, when my late father, a lifelong DIY investor, taught me the craft by hand, with graph paper and a pencil. So yes, I’ve been looking at MU charts since.
What I see here is that, no surprise, there’s volatility with MU. Lots of it. And when volatility has pushed a stock much higher as it has, that’s typically a time to get hedged, reduce position size, or perform some other form of risk management. I wrote about this option collar example recently, for instance.
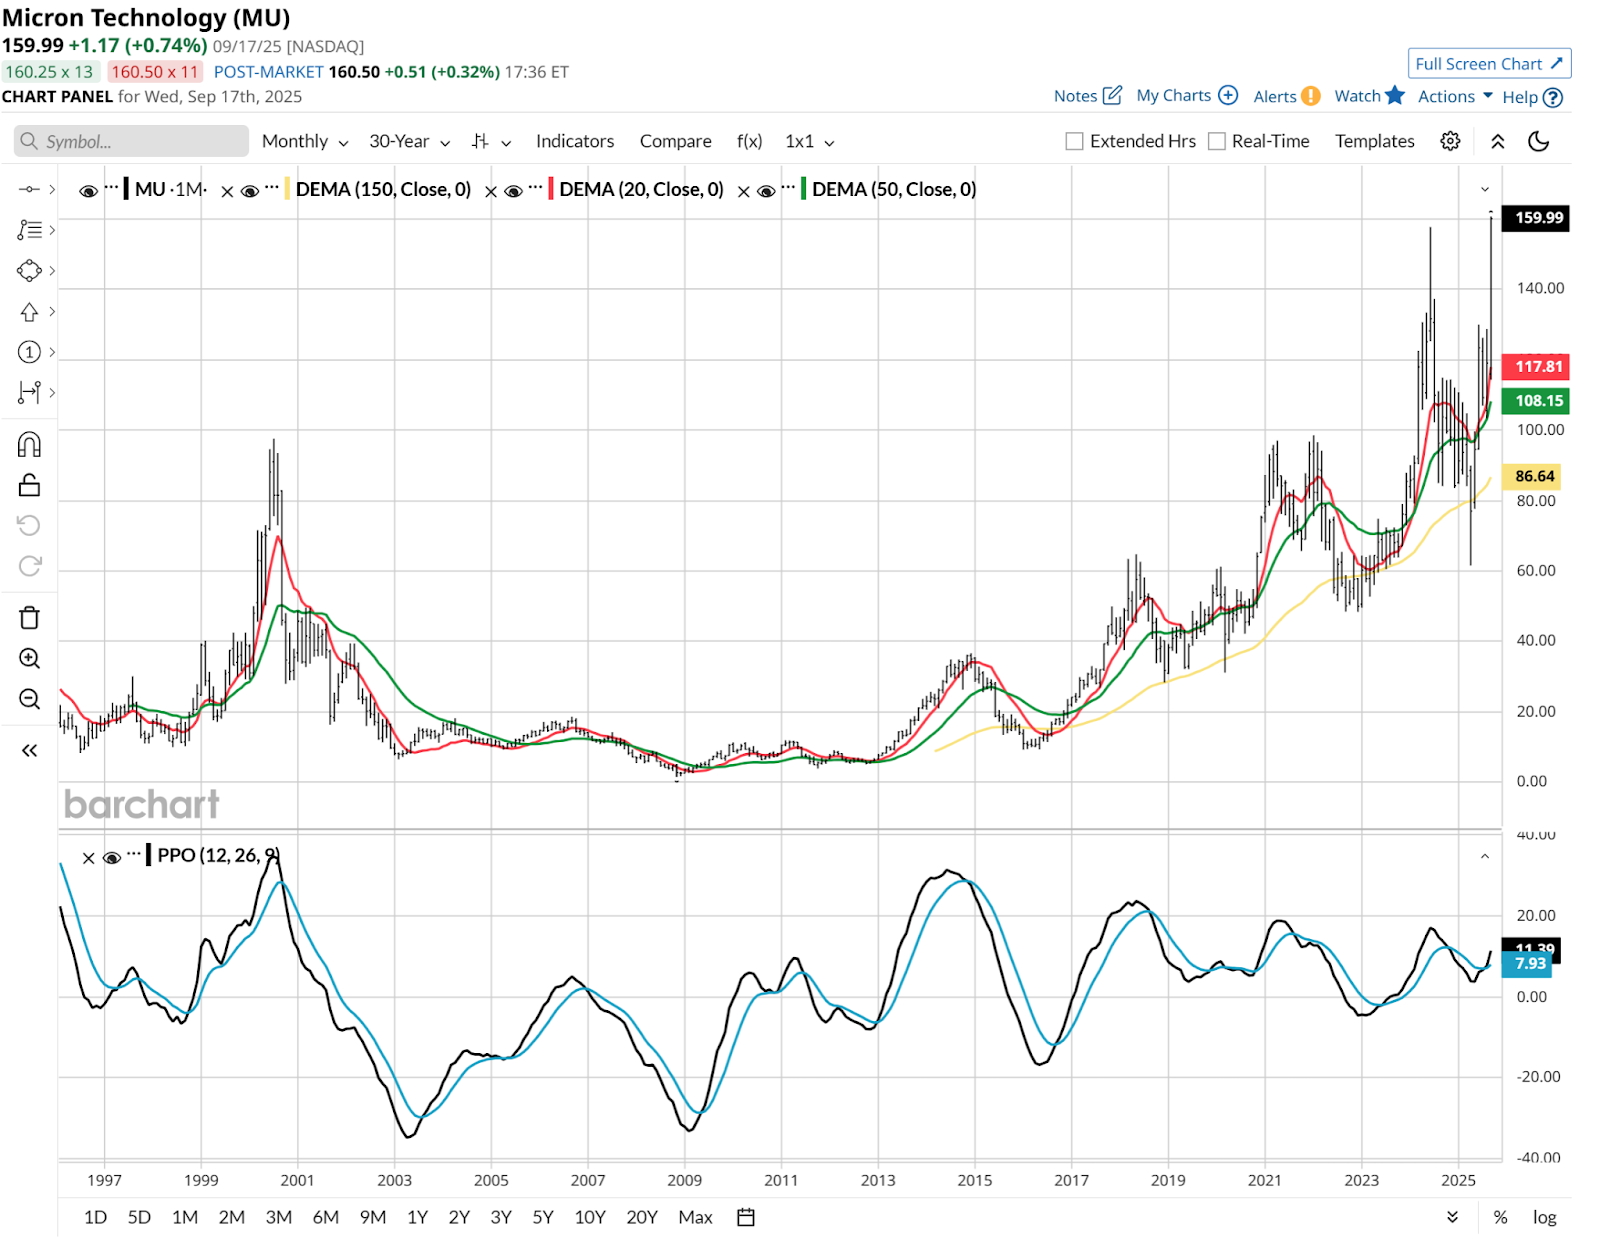
But it all depends on one’s time frame. There’s a case to be made for higher upside in this very long-term chart. That Percentage Price Oscillator (PPO) indicator at the bottom has crossed upward (black line through blue line), and that has historically been a catapult for bigger gains.
Dot-Com Veterans: Spiked Rallies, Crashes, and Everything in Between
In that sense, MU is a good proxy for a lot of former dot-com heroes that are still thriving, as well as the newer breed of AI favorites. And while any stock can go up for any reason, at any time, this is a good time to look both ways, so to speak.
If you do that in the monthly chart above, and look all the way to the left, you will see MU peaking at $97 a share in July 2000, only to bottom about 3 years later. At under $7 a share. Where did it trade intraday on June 3, 2025, about 15 weeks ago? $97 a share.
Zero return in 25 years. That’s no way to make a living. Be careful out there.
On the date of publication, Rob Isbitts did not have (either directly or indirectly) positions in any of the securities mentioned in this article. All information and data in this article is solely for informational purposes. For more information please view the Barchart Disclosure Policy here.